Test drive the Nomad autoscaler with Vagrant
The Nomad Autoscaler dynamically scales your deployed applications based on metric information to ensure you have sufficient work throughput to meet your service-level agreements.
Horizontal application autoscaling is the process of automatically controlling the number of instances of an application. In Nomad, horizontal application autoscaling can be achieved by modifying the number of allocations in a task group based on the value of a relevant metric, such as CPU and memory utilization or number of open connections. This is enabled by configuring autoscaling policies on individual Nomad jobs using the scaling block.
In this tutorial, you will use a Vagrant environment to:
Deploy the demonstration job files.
Prometheus, Loki, and Grafana jobs to collect metrics and log data from Nomad and provide them to the Nomad Autoscaler and the sample dashboard.
Traefik to distribute incoming web requests across instances of the web application.
A demonstration web allocation with a scaling policy.
The Nomad Autoscaler itself.
Enable a scaling policy on the web application job.
Generate load on the application to stimulate scaling.
Observe the autoscaler in action via the dashboard.
Prerequisites
Create your learning environment
You can get a local copy of the Nomad Autoscaler demos from a clone or an archive file of the GitHub project. Choose your preferred technique for detailed instructions.
Clone the hashicorp/nomad-autoscaler-demos repository.
Check out the learn tag. Using this tag ensures that the instructions in
this guide match your local copy of the code.
Change into the tutorial directory
The code for this demonstration is located in the
vagrant/horizontal-app-scaling directory. Change to that directory now.
Start the Vagrant environment
Use Vagrant to provision your virtual environment. This particular environment
consists of a virtual machine which runs a Nomad server and client for
scheduling work. To create the virtual machine, run the vagrant up command.
This takes a few minutes while Vagrant downloads the base Ubuntu box and provisions it with both Docker and Nomad. When you receive your shell prompt, the provisioning is complete.
Once you are returned to your shell prompt, the Vagrant environment is running
and ready to go. SSH into the Vagrant box using the vagrant ssh command.
Start the helper application jobs
There are several application job files that are used in this tutorial. Navigate
to the nomad-autoscaler/jobs directory.
The demo uses Traefik to provide ingress and load
balancing across the web application instances. This job also includes a
Prometheus exporter, which allows Traefik metrics to be exported to Prometheus.
Start the traefik.nomad job using the nomad run command.
You can verify the status of the job and the allocation using the nomad job status and
nomad alloc status commands.
Make note of the Allocation ID from the command output. You need it to query the
allocation's status. Export it into an environment variable named
TRAEFIK_ALLOC_ID for convenience.
This one-liner can collect it from Nomad and store it into the variable.
This tutorial uses Prometheus to collect the metrics from Traefik, Nomad, and
the virtual machine itself. Start the Prometheus job using the nomad run
command.
The virtual machine is set to forward a number of ports to your localhost, including the Prometheus UI.
To visualize the state of the system and better understand what actions are being taken by the autoscaler, you can run the Loki and Grafana services. The provided Grafana job also installs a sample dashboard.
Once the services have started, you can access the dashboard on the machine running the Vagrant VM. This tutorial discusses this dashboard in greater detail later.
Start the autoscaler job
The autoscaler Nomad job can now be submitted.
Make note of the Allocation ID from the command output. You need it to query the
autoscaler's allocation status and its logs. Export it into an environment
variable named AUTOSCALER_ALLOC_ID for convenience.
This one-liner can collect it from Nomad and store it into the variable.
Check the logs of the autoscaler to see that it has started up correctly. Note
that you need to pass the -stderr flag to the nomad alloc logs command since
the autoscaler logs to standard error rather than standard output.
Once the autoscaler task has started completely, the last logged line should say "server now listening for connections."
Review and run the webapp job
The webapp.nomad job file contains a scaling stanza which defines the key
autoscaling parameters for a task group. There are a number of interesting key
options to understand.
enabled = falseis a parameter to allow operators to administratively turn off scaling for a task group.source = "prometheus"specifies that the autoscaler use the Prometheus APM plugin to retrieve metrics.query = "scalar(avg((traefik.."is the query that the autoscaler runs against the APM and is expected to return a single value.strategy = { name = "target-value" }defines the calculation strategy for the autoscaler to use. In this case, the strategy targets a specific value.
Run the webapp.nomad job.
Nomad starts three allocations of the example web application based on the count specified in the job.
Enable the scaling policy and scale down
The submitted webapp job has a scaling stanza, but explicitly turns off scaling.
To enable the task group for scaling, edit the file and change the enabled = false line to read enabled = true within the scaling stanza. Once updated,
preview what changes are to be made using the nomad plan command.
Submit the updated version of the job.
The autoscaler now actively evaluates the example group of the webapp job.
Revisit the autoscaler logs now using the nomad alloc logs command and note the
activity related to the updated job.
The autoscaler starts acting on the policy given in the job specification and checks the APM to see if the job needs to be scaled up or down.
Delve into the autoscaler's decision process
Earlier you read about the components specific to the webapp job. Once you
enabled the scaling policy and resubmitted the webapp job, the Nomad
autoscaler starts running the provided query on an interval. The autoscaler's
configuration provides a default evaluation interval. If this value is not
configured explicitly it is set to 10 seconds. You can also set the scaling
policy's evaluation_interval to explicitly override the configured default.
In this case, neither the scaling policy or the autoscaler configuration specify a policy, so the query is executed every 10 seconds.
The Nomad Autoscaler runs the query provided in the webapp job specification. Here it is, wrapped for readability.
This Prometheus query returns the average of current Traefik sessions on our
webapp by dividing the sum of all open connections by the number of running
allocations.
The autoscaler then consults the strategy specified in the policy. This policy uses the target-value value plugin with a value of 5. Nomad will attempt to scale up or down to attempt to get the value returned by the query to be equal (or close based on a configurable threshold).
In the idle case, the query returns 0, so the autoscaler would try to scale the job down to increase the value returned by the query and approach the target value.
The autoscaler never scales a job group past either the min or max
parameters. This ensures applications maintain high availability even during
minimal load, while also not over scaling due to problems such as
misconfiguration or faulty metrics values.
The autoscaler observes that the application is idle and scales it down to the
min count of 1.
Generate load and scale up
The VM includes hey, a HTTP load generator. Use it to generate load on the
web application to stimulate scaling. Create a second SSH session to your
virtual machine. Inside this terminal, run the following hey command to generate
30 simultaneous connections to the web application for a 1 minute session.
The increase in load is reflected through Prometheus metrics to the autoscaler. Checking the autoscaler logs, note the messages indicating it has chosen to scale out the job due to the increase in load.
The autoscaler observes that the application is busy by a factor of 6x the target value and scales it up to meet the demand.
Explore the dashboard
The dashboard shows key metrics that drive the autoscaler and actions taken by the autoscaler based on them.
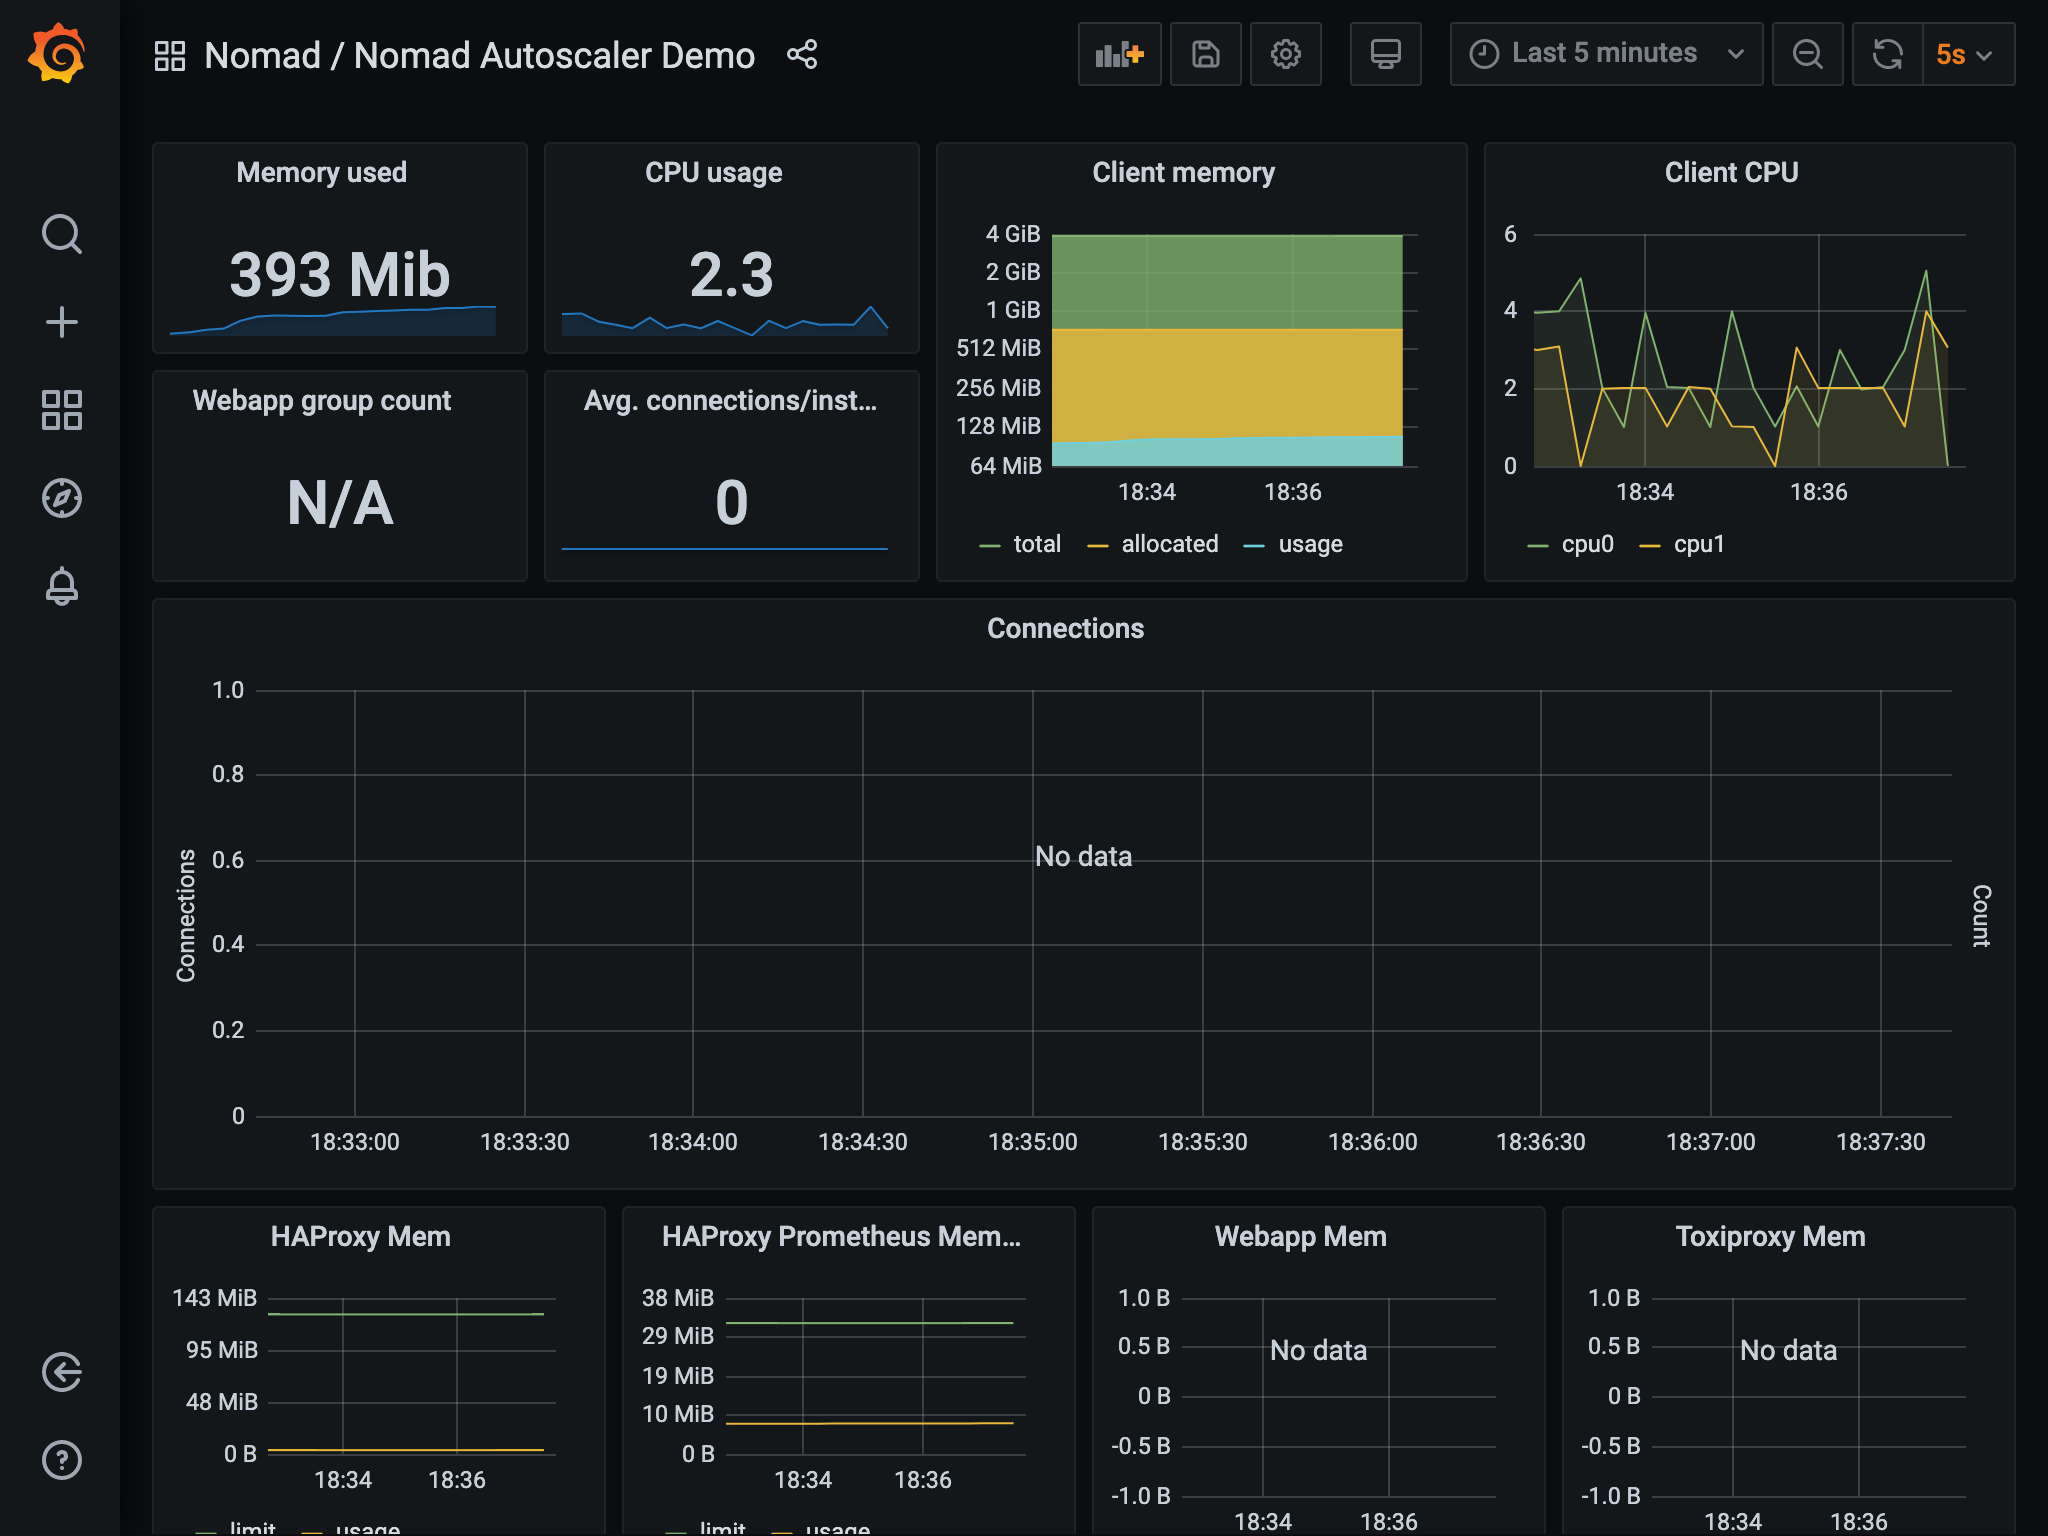
The green shaded area in the middle of the dashboard is the count of the
webapp task group that the autoscaler is acting on. The blue line is the total
number of connections hitting the services. The purple line is the average
number of connections per instance of webapp (which is also the metric the
autoscaler is monitoring in the policy).
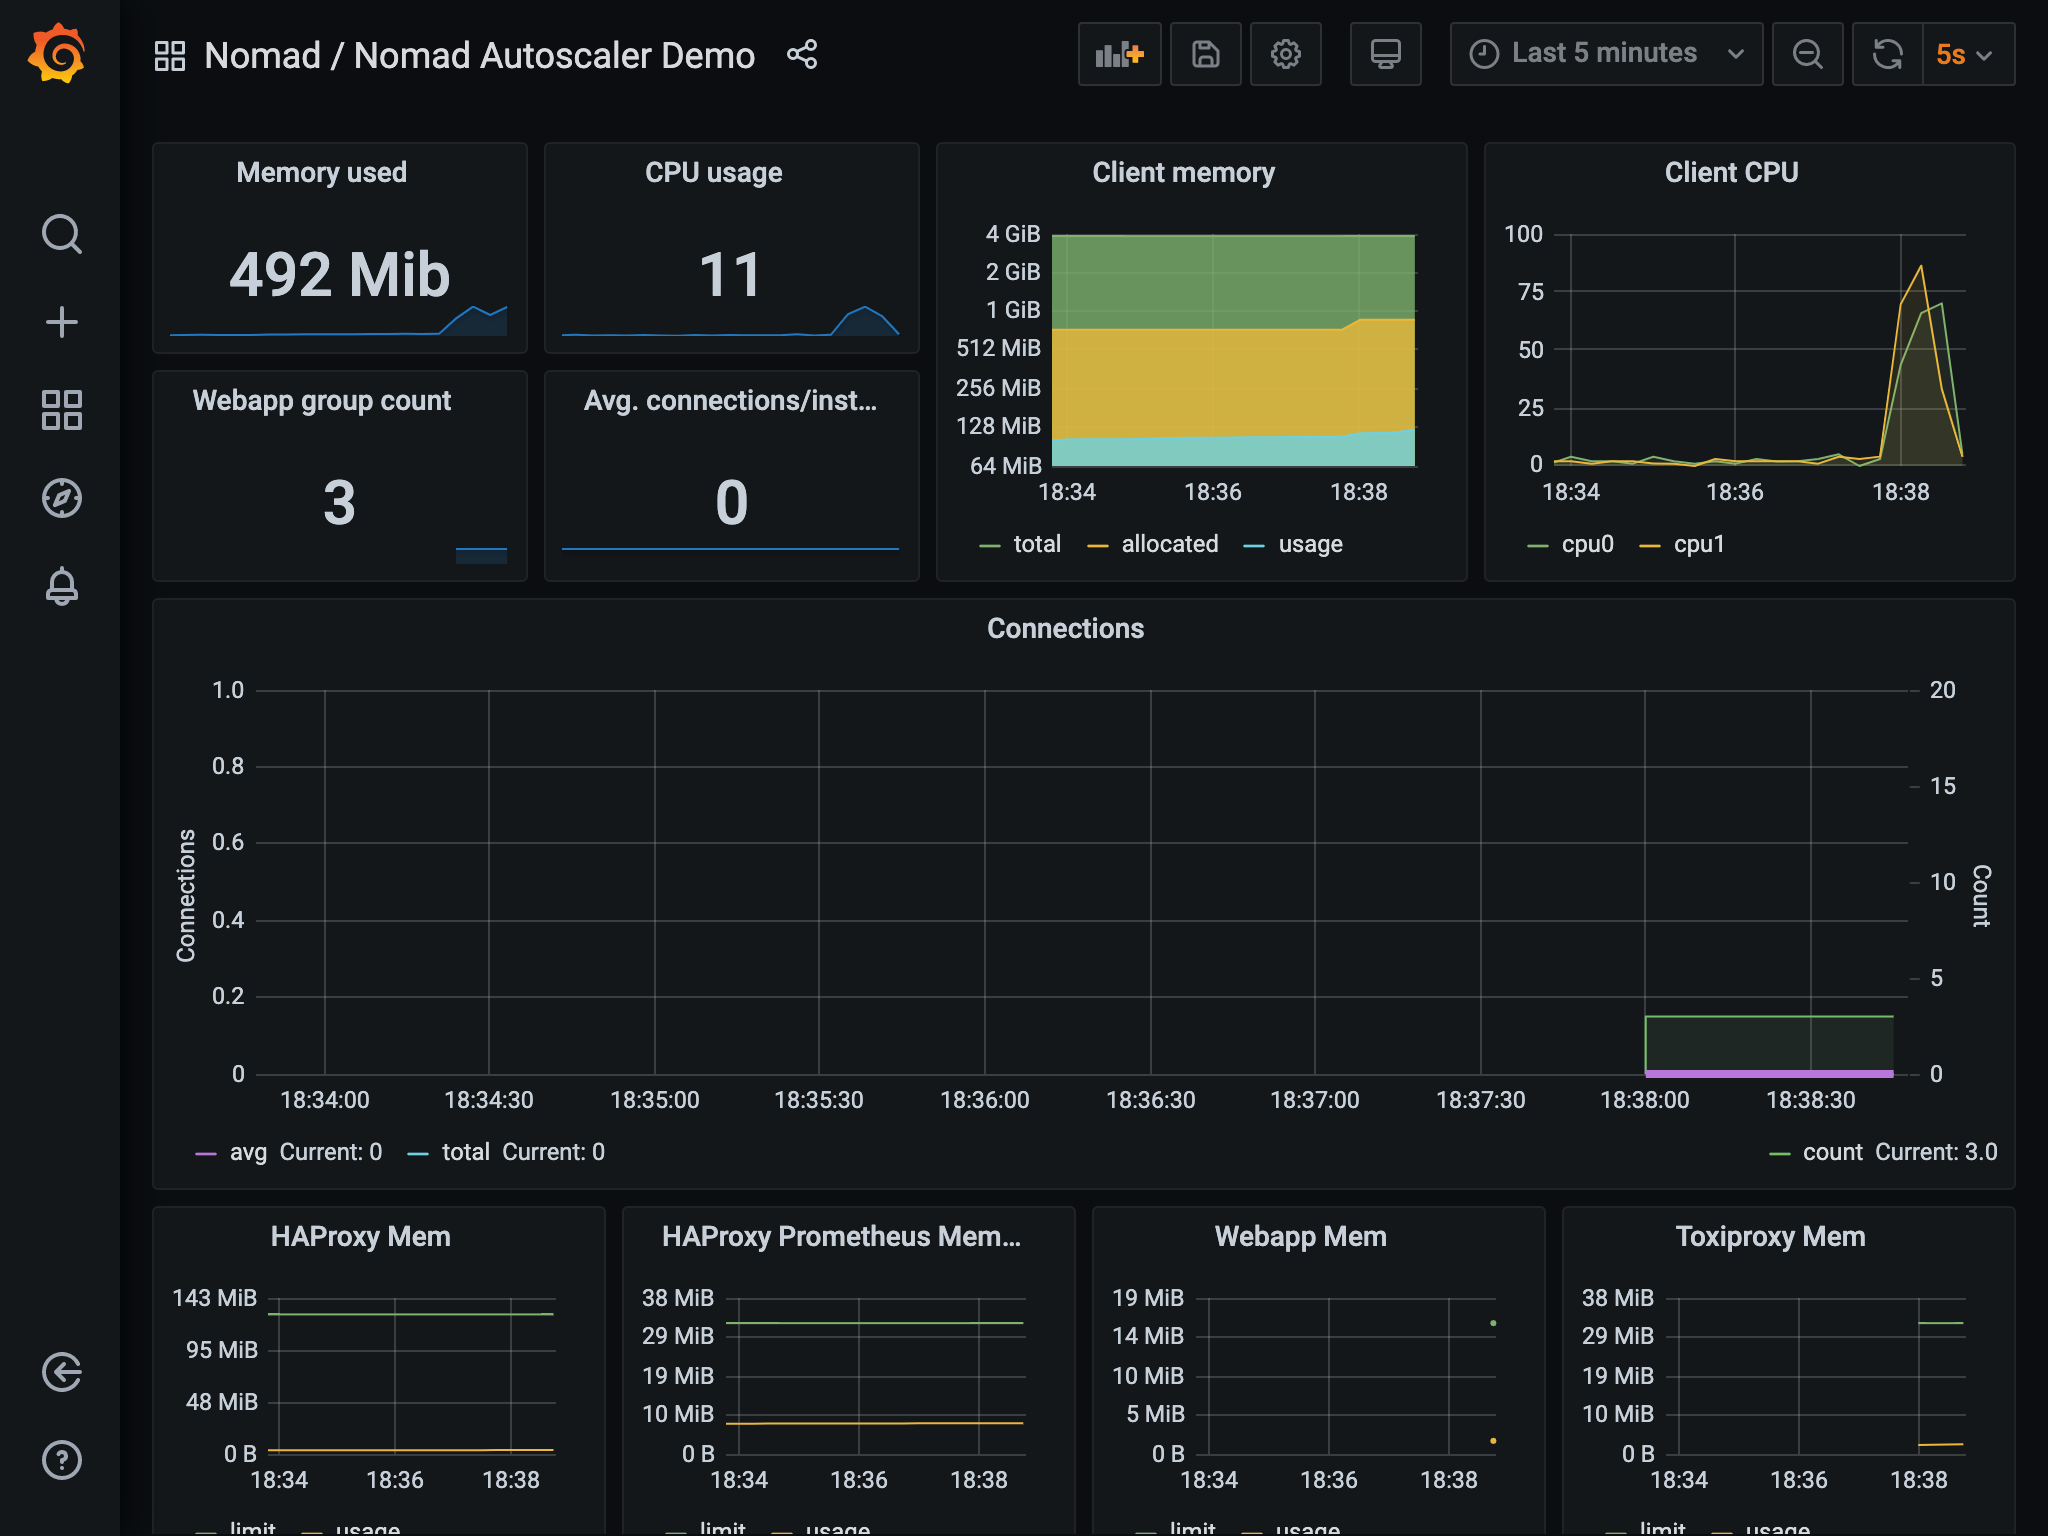
The count metric starts at 3. Once the autoscaler is started and the autoscaling
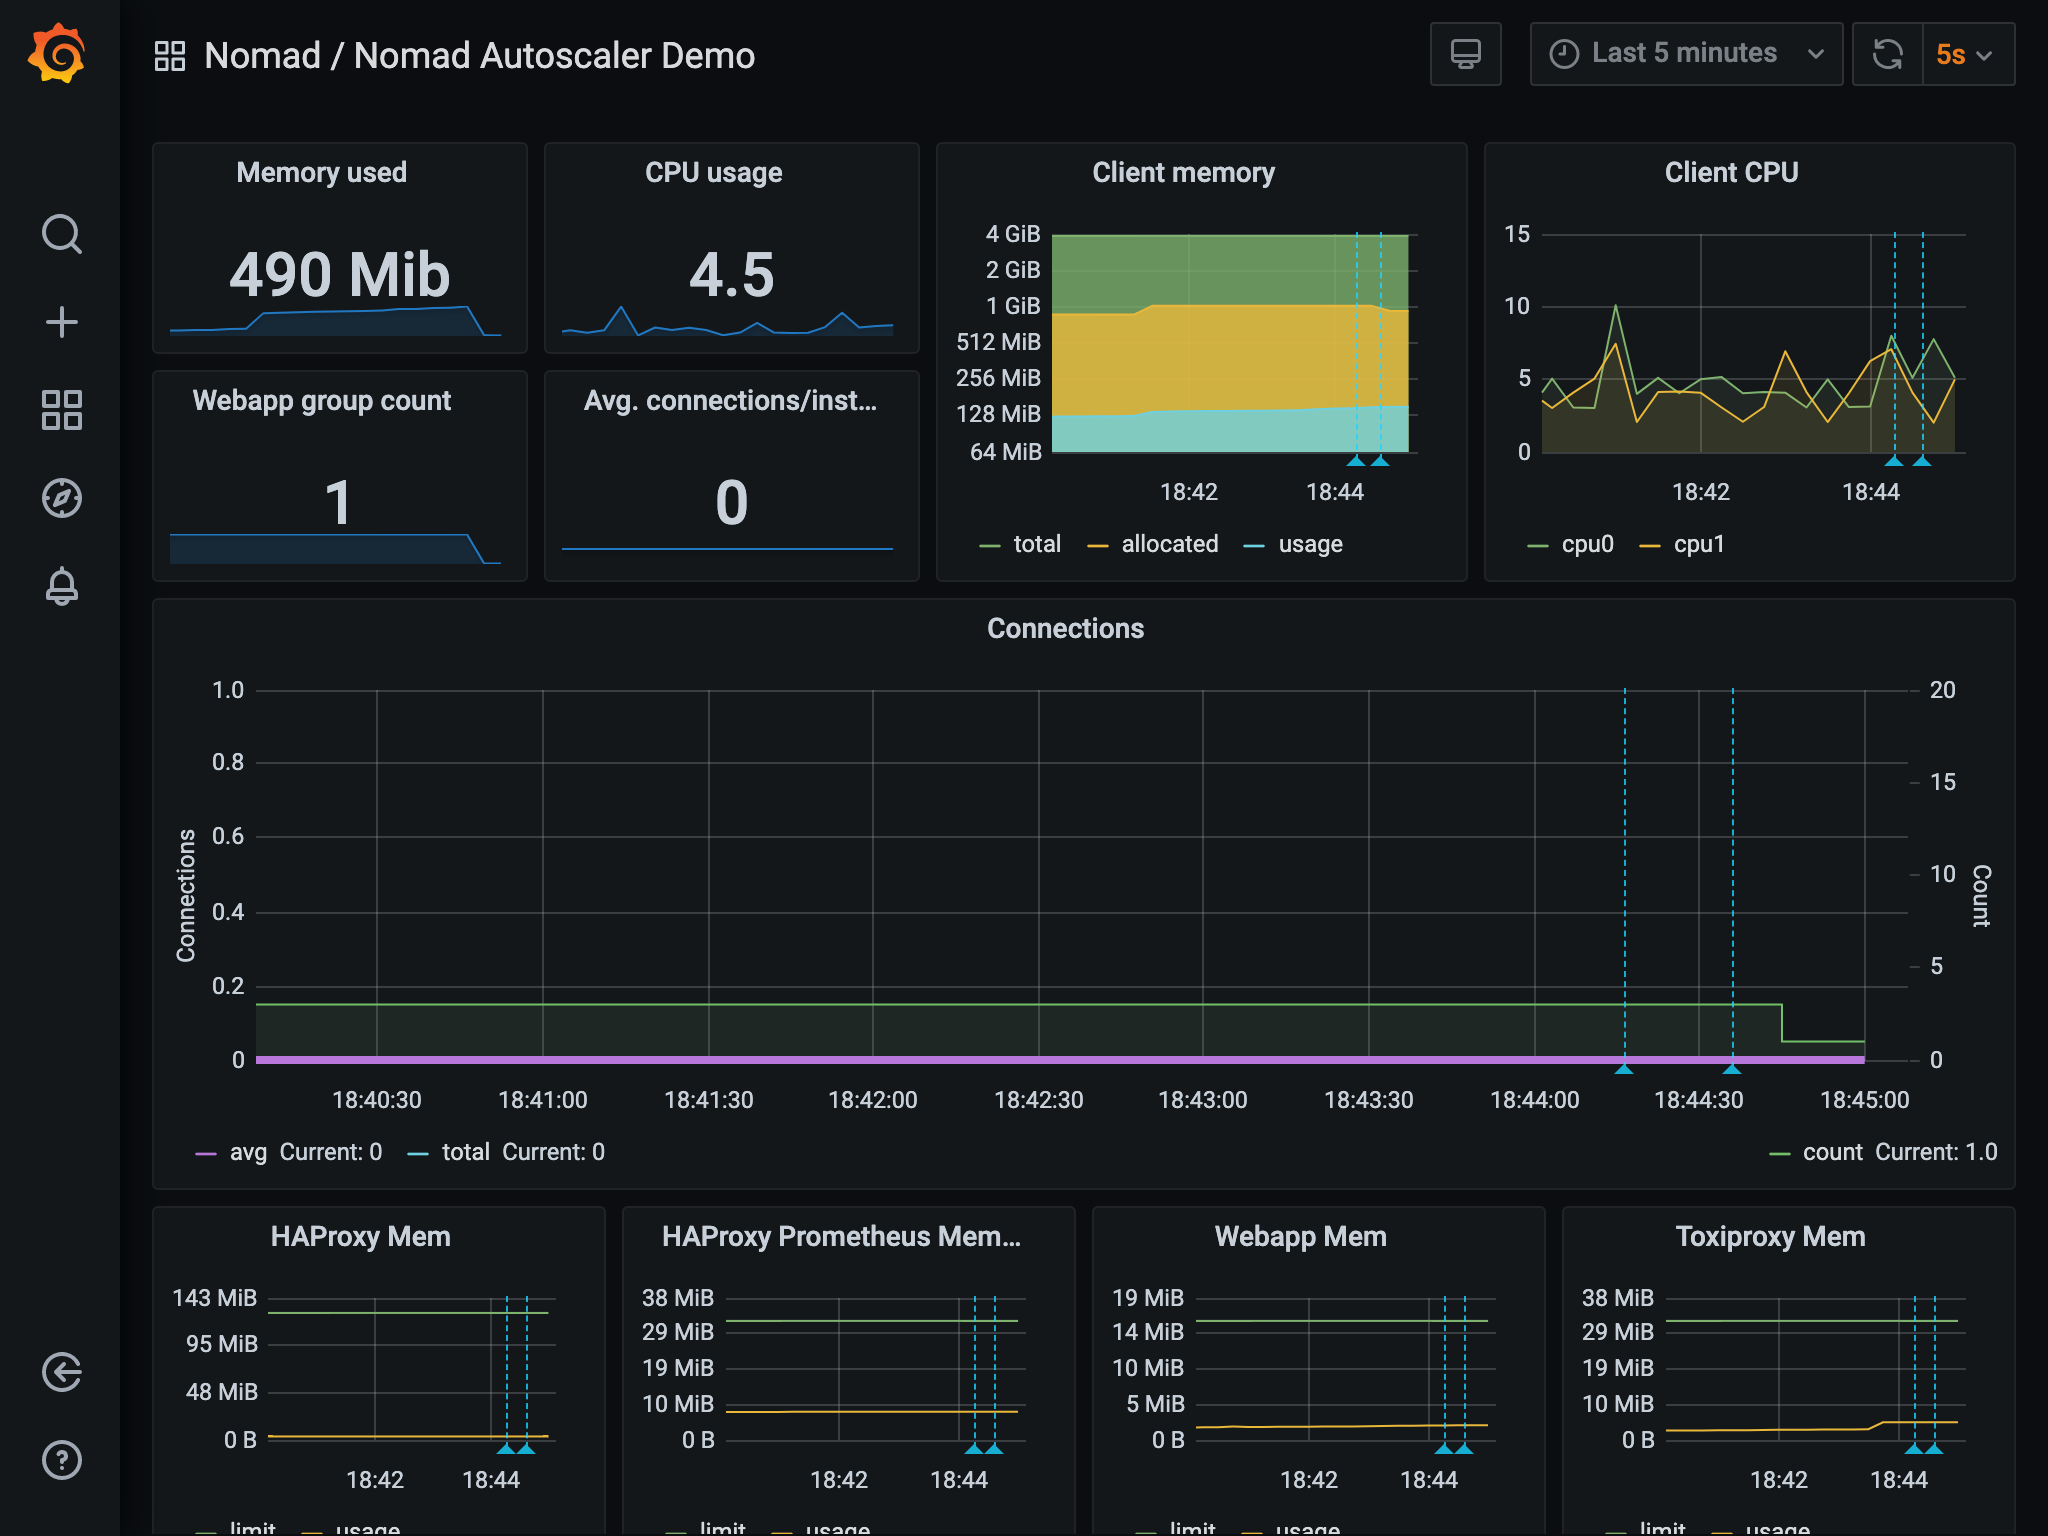
policy is enabled in the webapp job, the count lowers to
the min value of 1 because the average number of connections is at 0.
Once you run the hey command and start to generate load into the system, the
number of connections sharply increases, along with the average.
The autoscaler observes this spike and reacts a few seconds later by increasing
the count. This adds more instances of the web app to handle the load and drop
the average number of connections to the target value.
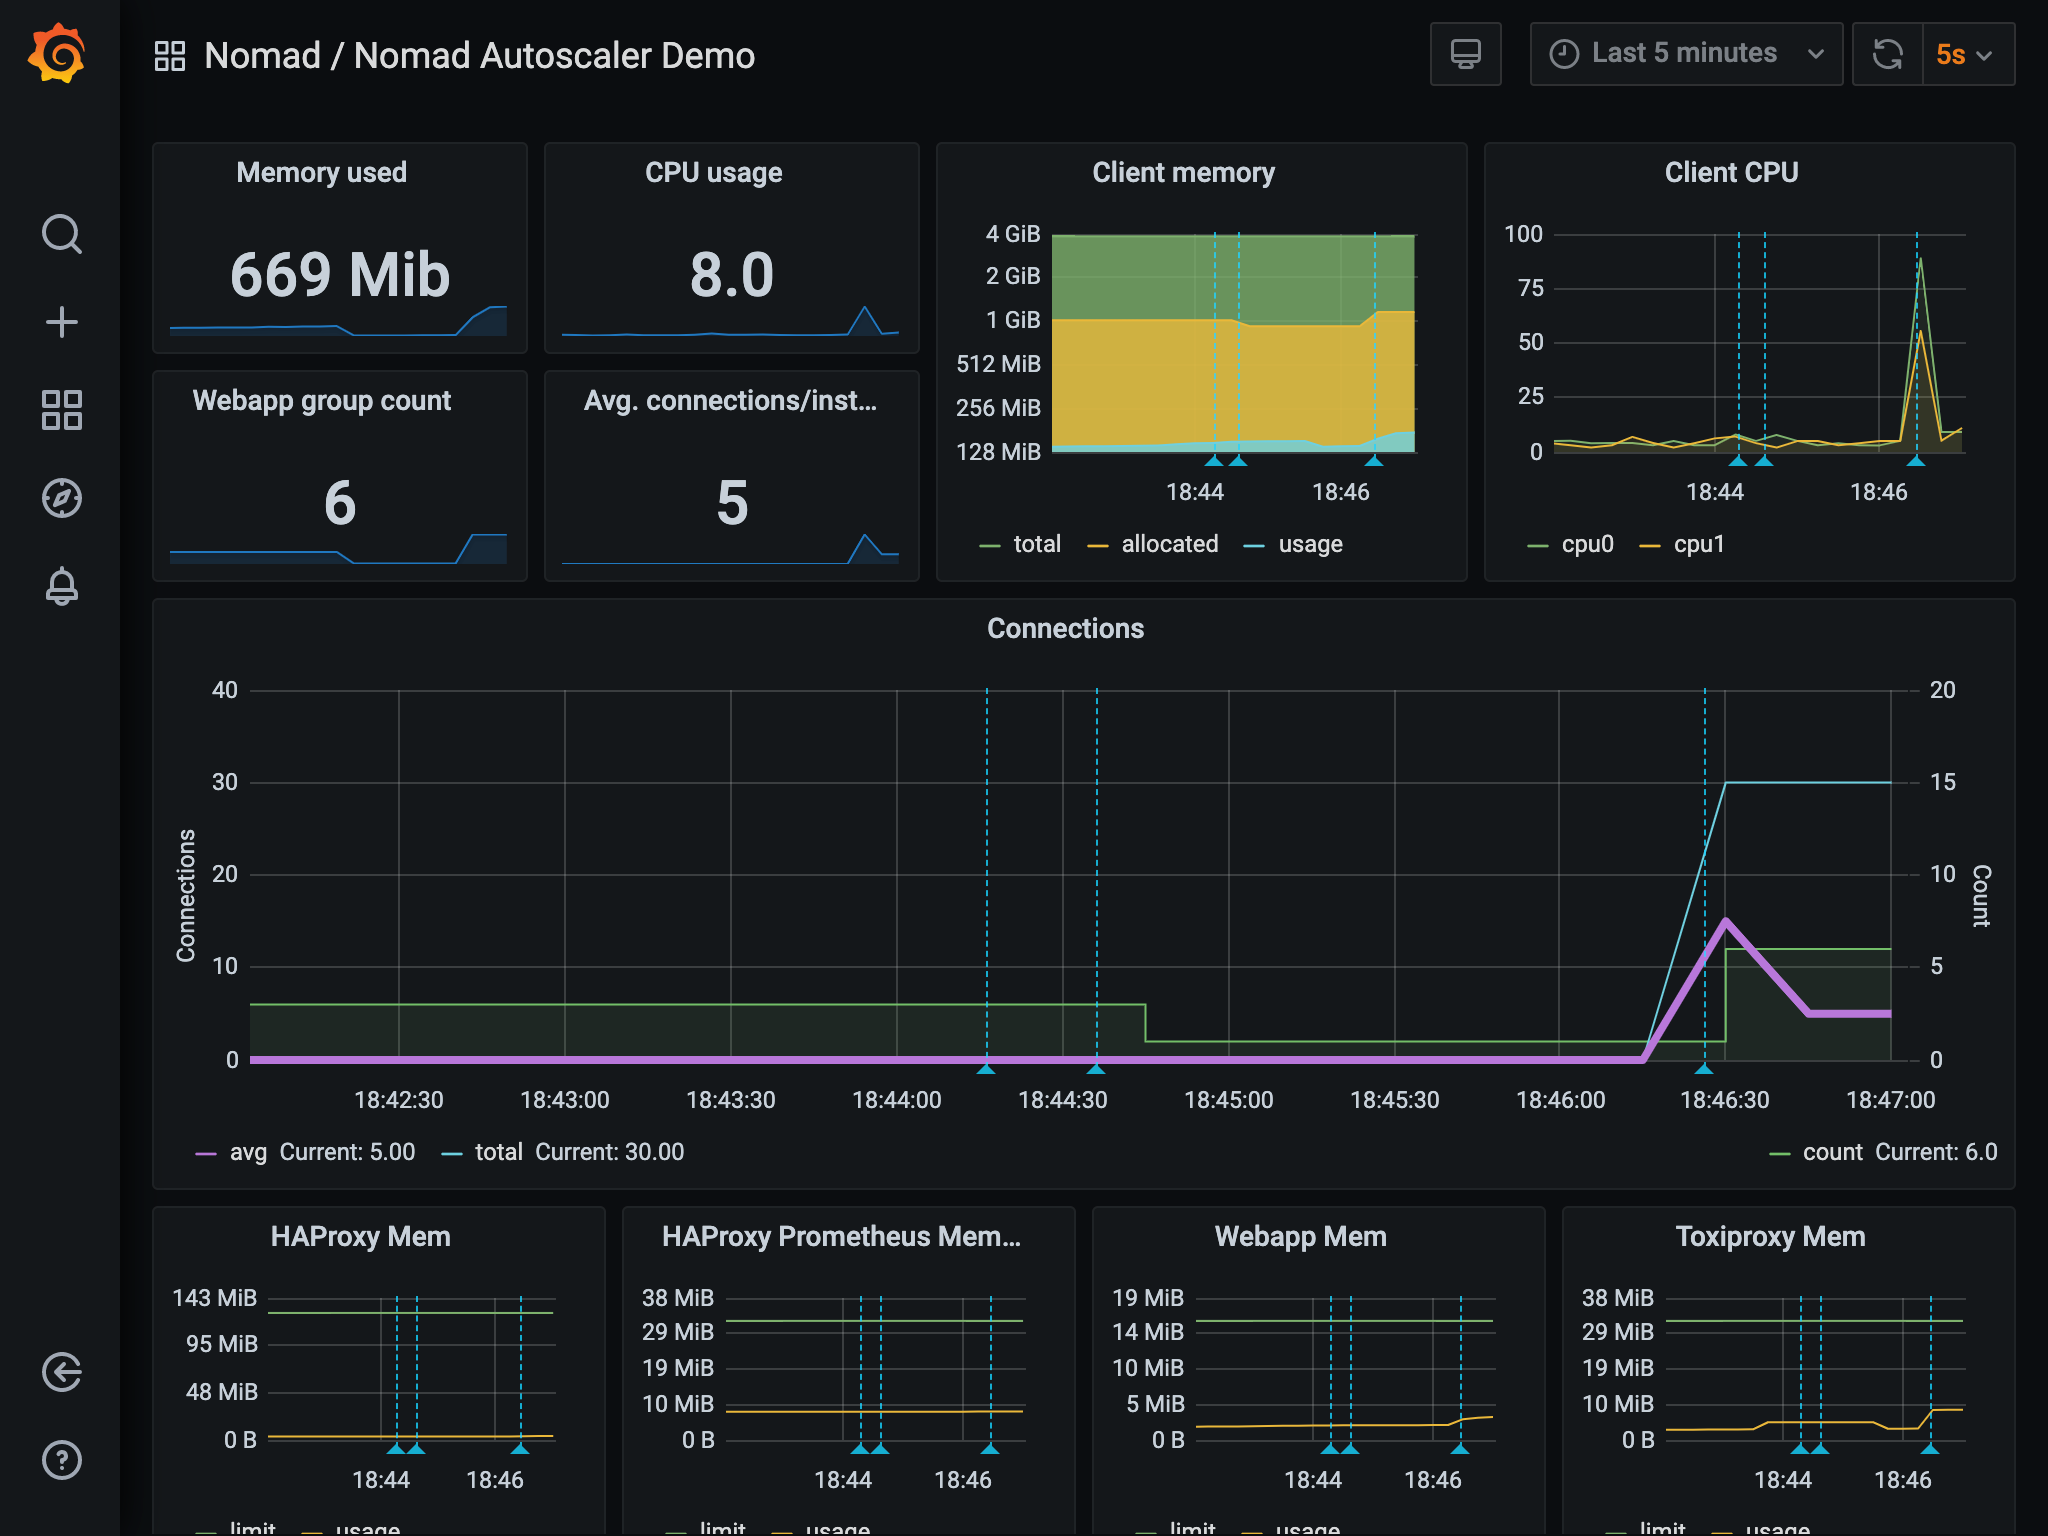
Once the load is removed, the autoscaler returns count to 1.
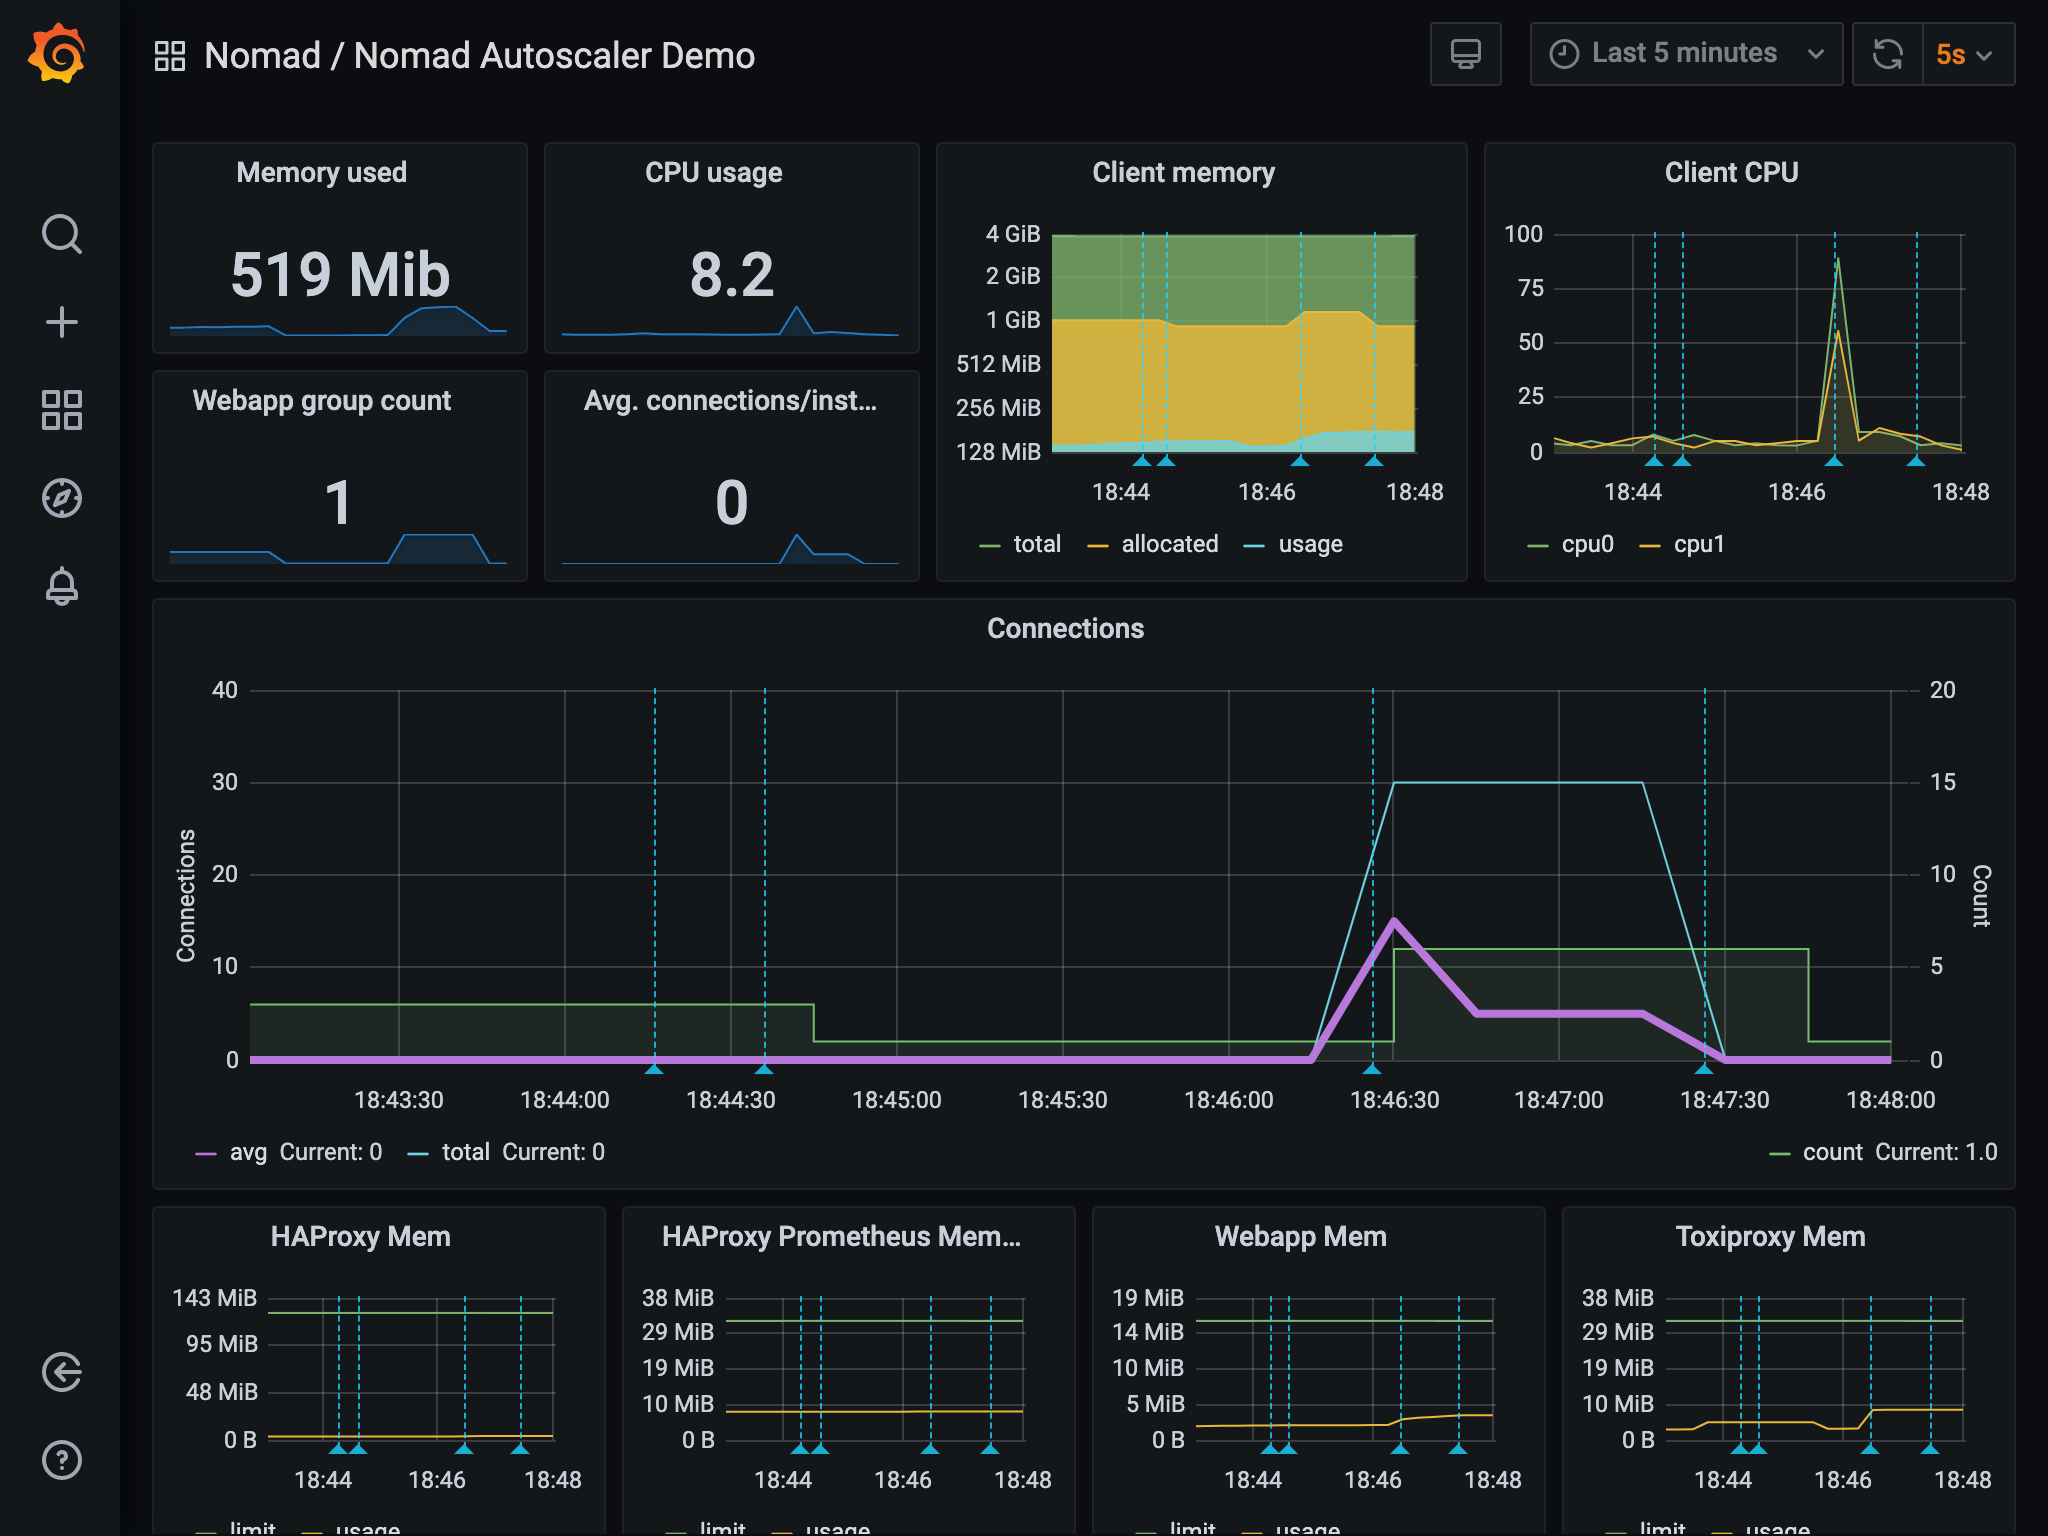
The log entries for the scaling actions performed by the autoscaler are automatically added to the graphs as annotations represented by the dashed light blue vertical lines. Hovering over them displays more details about the scaling event.
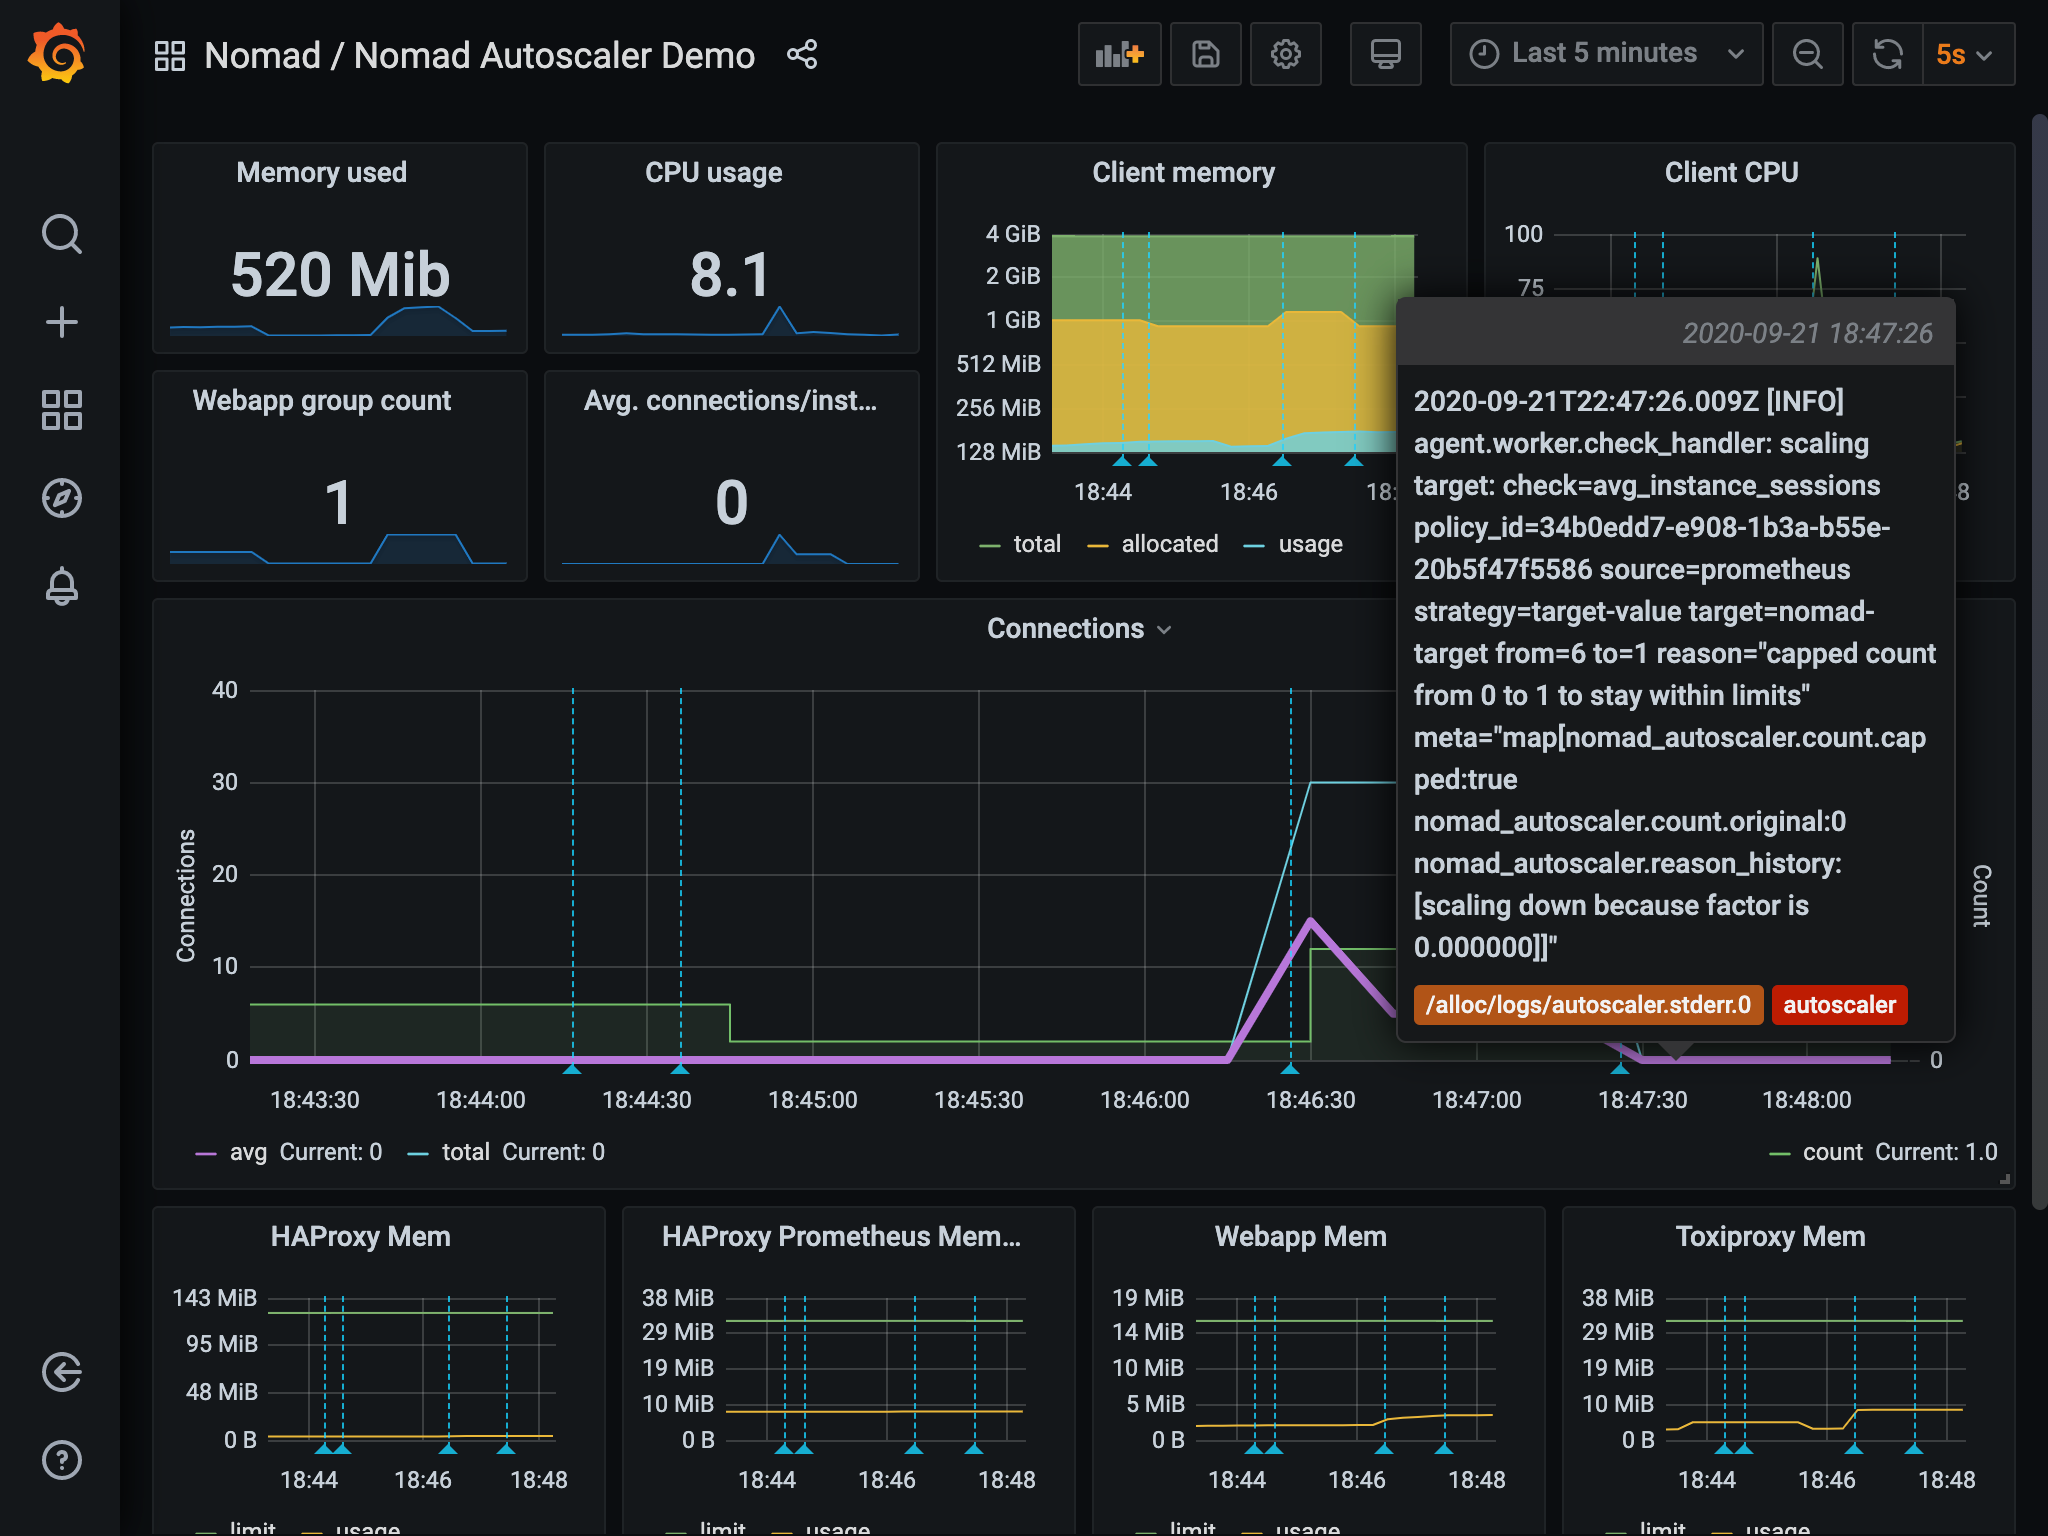
The actual values you observe might be different, but the general idea of
count reacting to the average number of connections should be noticeable.
Explore more
Consider experimenting with different autoscaler policies, load generation parameters, and scaling queries.
Clean up after the demo
Once you are done using the Vagrant virtual machine, exit your SSH
session by running exit.
When you return to a local system prompt, destroy the virtual machine by
issuing a vagrant destroy -f command.
After the VM is de-provisioned, you may change to the parent directory and remove the folder that was created at the start of the tutorial.
Learn more
Now that you have explored a demonstration of the Nomad Autoscaler, continue learning more about it with these resources: